

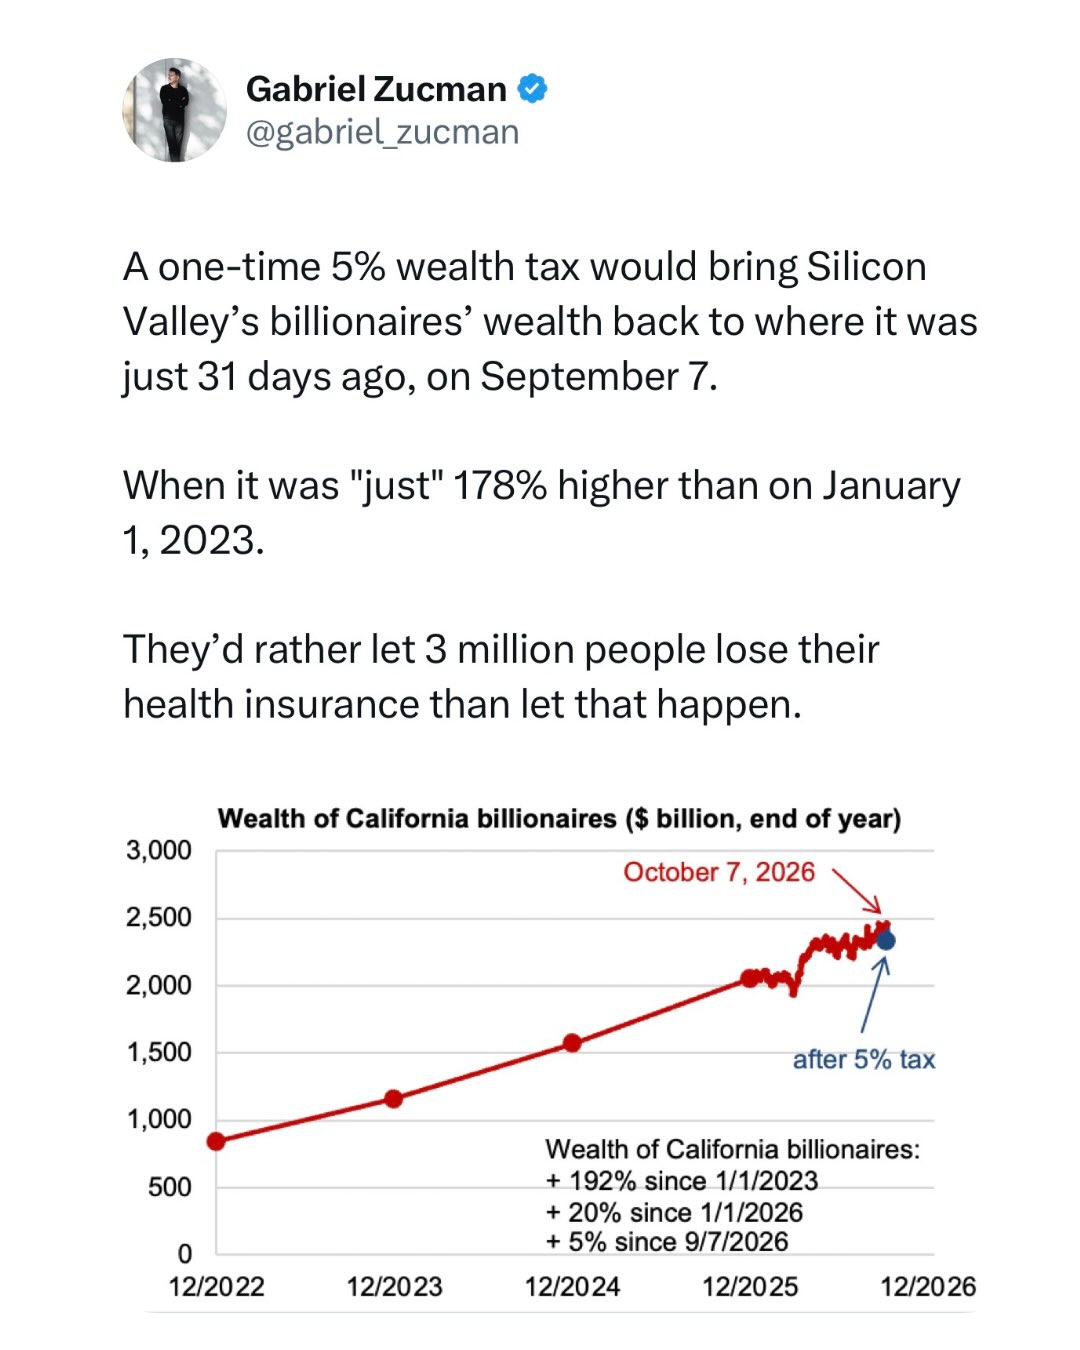
A one-time 5% wealth tax would bring Silicon Valley’s billionaires’ wealth back to where it was just 31 days ago, on September 7.
When it was “just” 178% higher than on January 1, 2023.
They’d rather let 3 million people lose their health insurance than let that happen.
Graph here: https://cabillionairetracker.org/
Rather than paying their fair share of taxes, Sergey Brin, Pether Thiel, and Patrick Collison prefer to spend tens of millions to manipulate the vote.
Stupefying levels of greed and lack of civil-mindedness.
$45 million in a week: California’s wealthy aren’t holding back to try to stop ‘billionaire tax’
All credits to Gabriel Zucman
Great message, but that graph is horrible…
The Y axis starts at zero at least…
But yeah, not having consistent dots on the X axis fucks it up.
They should have started with Dec 2025 when they had more frequent data and left the rest off.
That’s why it looks so off. Whoever made it was just trying to do too much, but as far as graphs that get posted on social media, sadly this is a pretty good one.
It’s a very low bar
I’m confused. It’s not perfect, but it does have consistent dots for the X axis, every year.
And yeah, they could have started with Dec 2025 and left the rest off… but part of the point of the graph is showing how billionaires have almost tripled their wealth since 2022, at the expense of everyone else.
I’m not sure what you mean by “consistent”…
It’s one a year up to dec 2025, then after that do you notice how the lines goes up and down super fast?
That’s because there’s a shit ton more dots there, even if they’re not large enough to see, any change in slope means there’s a new data point.
Doing one a year and then one a week is not consistent.
Right…
The person who made it likely just crammed two different graphs (or underlaying datasets) together, and most likely had a chatbot do it for them.
That’s actually why I blocked the “data is beautiful” community here, it was just people who know nothing of statistics jamming two graphs together like that accomplishes anything except making the information harder to read, which making the information easier to read is the literal purpose of graphs.
Most people never take even a single stats class, and just don’t know what the fuck they’re doing.
Edit:
I’m also confused, why did you downvote me and ask me to explain?
It makes it look like you just want to argue instead of learn. I’m happy to help, but I really don’t care what you learn, if you just want to argue find someone else.